What Happens When You Throw Noise and Rotation at a CNN
View on GitHubThis was one of my senior projects for my deep learning course at Stevens. When we were told to come up with a final project, I knew I didn't want to do what everyone else was going to do. I started doing some research and came across the MNIST and USPS datasets for handwritten digits — and I thought this would be a perfect way to really showcase my understanding of how these models work at a fundamental level.
Right from the start, I knew I wanted to go beyond just getting high accuracy on clean data. Anyone can train a model on pristine images and call it a day. I wanted to mess around with adding noise and rotations to the training mix to see how a model would actually react to unexpected changes in the input data.
The Setup
I used two real-world datasets:
- MNIST — the classic benchmark, 70,000 handwritten digits at 28x28 pixels
- USPS — digits from actual US Postal Service mail, with a noticeably different handwriting style
The USPS images were originally 16x16 pixels, so I had to make a decision on how to combine them. I ended up padding USPS up to 28x28 rather than shrinking MNIST down — it was just easier to add padding than to lose resolution. Both datasets were then fed through the same CNN.
The nice thing about these datasets is that they were already clean. Everything was normalized and standardized, which was great as a starting point — I could confirm the model actually worked before I started throwing curveballs at it.
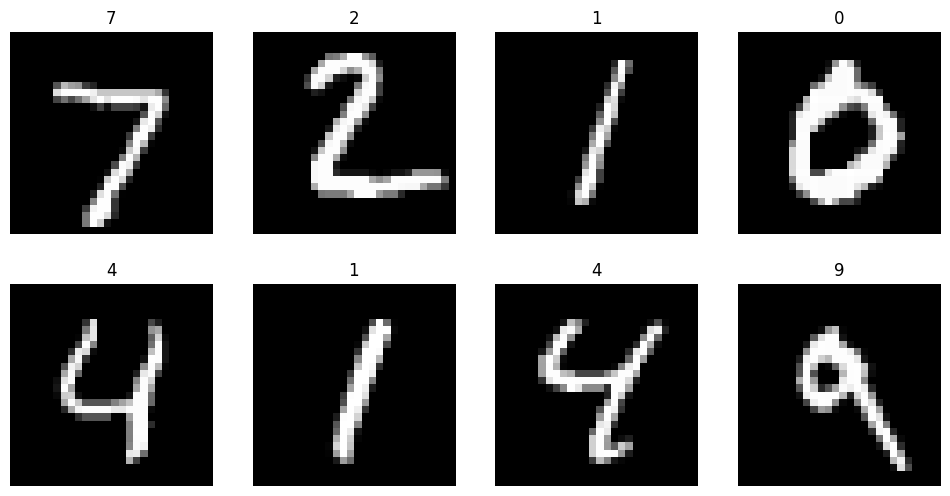
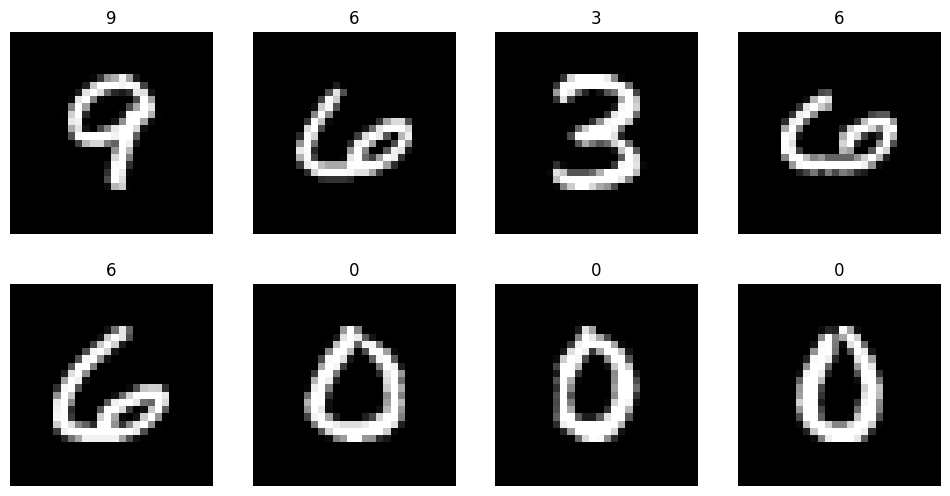
Sample Digits
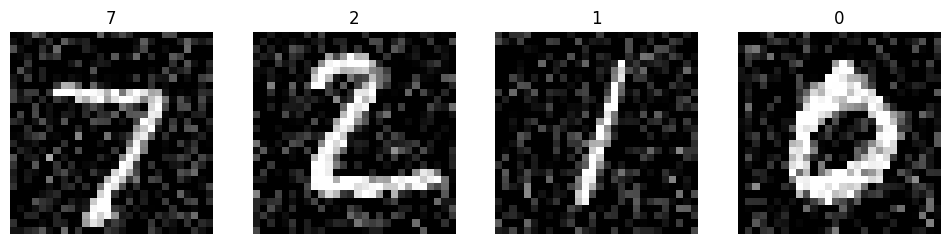
MNIST samples:
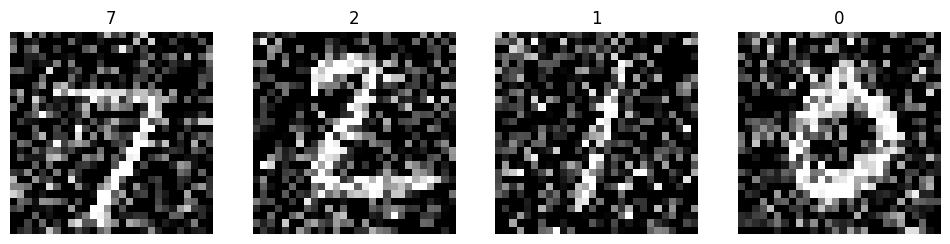
USPS samples — notice the different handwriting style:
Getting the Baseline
I was able to get a baseline model working on the clean data fairly quickly with decent accuracy:
| Dataset | Accuracy |
|---|---|
| MNIST Clean | 98.65% |
| USPS Clean | 96.31% |
| Combined Clean | 98.26% |
But the difficult part came when I started introducing noise. The results were way worse than I thought they should have been:
| Noise Level | MNIST Accuracy | USPS Accuracy |
|---|---|---|
| Clean | 98.65% | 96.31% |
| 25% | 97.86% | 95.81% |
| 50% | 93.78% | 90.13% |
| 100% | 62.02% | 53.96% |
At full noise, the USPS accuracy was barely above random guessing. The model had learned what clean digits look like, but it had no idea how to see through noise.
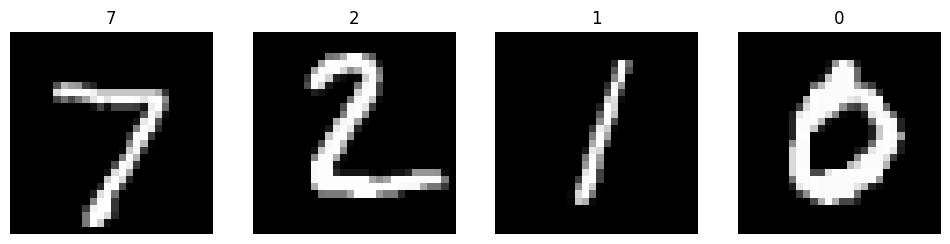
Here's what increasing noise levels actually look like on the same digits:
Clean (0% noise):
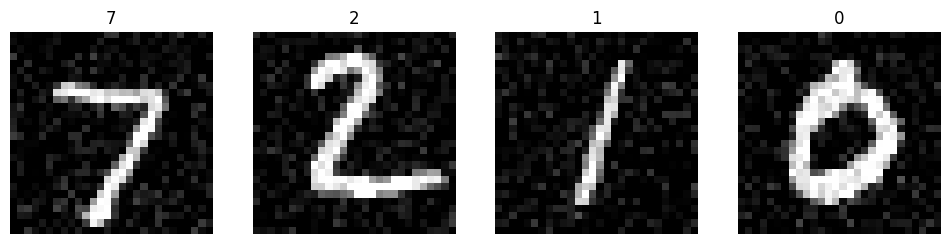
Light noise (~25%):
Moderate noise (~50%):
Heavy noise (100%) — nearly unrecognizable even to a human:
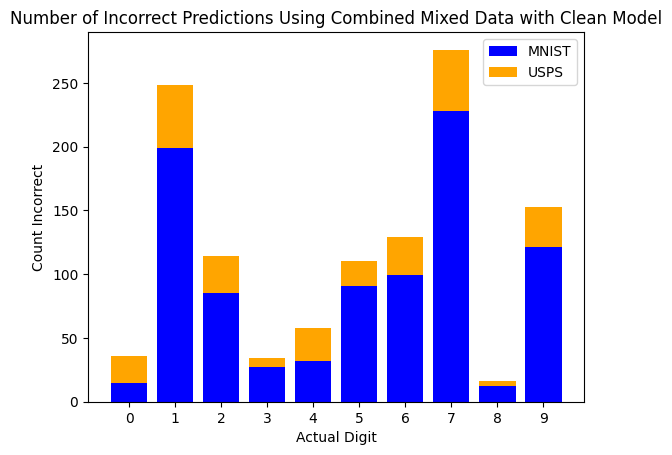
Looking at what the clean model got wrong, it racked up close to 275 incorrect predictions on the digit 7 alone — the noise was obscuring the thin strokes that make a 7 distinct from other digits, and the model had no idea what it was looking at anymore.
Finding the Right Model
This is where I had to restructure the model itself. I wasn't happy with the initial architecture, so I wrote a script to automate the search. It iterated through different combinations of learning rates, batch sizes, and epoch counts — essentially a coordinate descent across all of them:
- Learning rates: 0.01, 0.001, 0.0001, 0.00001
- Batch sizes: 16, 32, 64, 128
- Epochs: 5, 10, 15, 20
I kicked it off overnight and let it run. It cycled through up to 3 full trials, training a fresh model for each configuration and comparing accuracy. The final values it landed on — learning rate of 0.0001, batch size of 16, 15 epochs — were not what I had originally expected the model to need. But that was the whole point.
The final architecture I settled on was a 3-layer CNN:
- Conv layers: 32 → 64 → 128 filters (3x3 kernels, ReLU, MaxPool after each)
- Dense layer: 128 units with ReLU
- Output: 10-unit softmax
- Optimizer: Adam (LR 0.0001), sparse categorical crossentropy
Training on Noise
Once I had the right model structure, I trained a "mixed model" — one that saw both clean and noisy examples during training. The noise was Gaussian (random standard deviation between 0 and 100), applied to 75% of the training images so it still saw some clean ones too.
The difference was night and day:
| Test Condition | Clean Model | Mixed Model | Improvement |
|---|---|---|---|
| MNIST Clean | 98.65% | 98.12% | -0.53% |
| MNIST 100% Noise | 62.02% | 94.51% | +32.49% |
| USPS Clean | 96.31% | 96.61% | +0.30% |
| USPS 100% Noise | 53.96% | 90.23% | +36.27% |
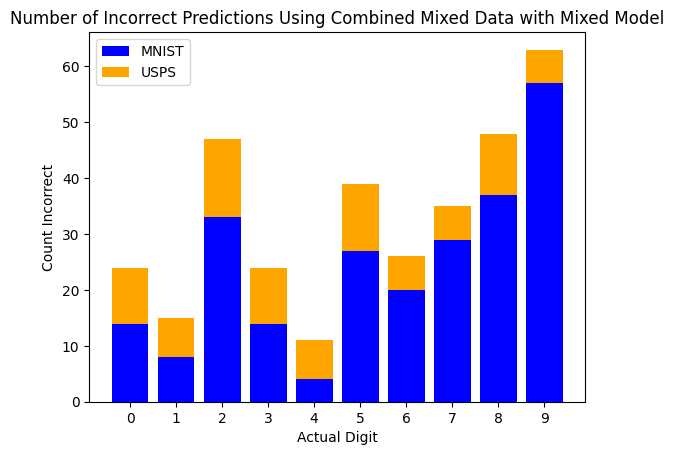
The accuracy on clean data barely dropped — less than 1% — but the model went from 62% to 94% on heavily noisy images. If anything, the noise made the model stronger. It was just a better overall model. Whenever I threw a new image at it that it hadn't seen before, it was noticeably more reliable.
The error chart tells the story — max errors dropped from 275 to just 63:
The Rotation Problem
This is where things got really interesting. I started adding random rotations (anywhere from 0 to 360 degrees) to see how the model would handle orientation changes. I didn't do this originally — I was just doing noise at first — and when I finally added rotations, it was nearly impossible for the model to be reliably accurate.
The reason is pretty intuitive once you think about it: there are a ton of numbers that look very similar depending on what orientation you rotate them. Sixes and nines are the obvious one — rotate a 6 by 180 degrees and it is a 9. But fours and fives can look similar when rotated, especially when people are writing them fast. Sevens and ones too. When you're only giving the model a single digit with no surrounding context, it has no way of knowing what's up and what's down.
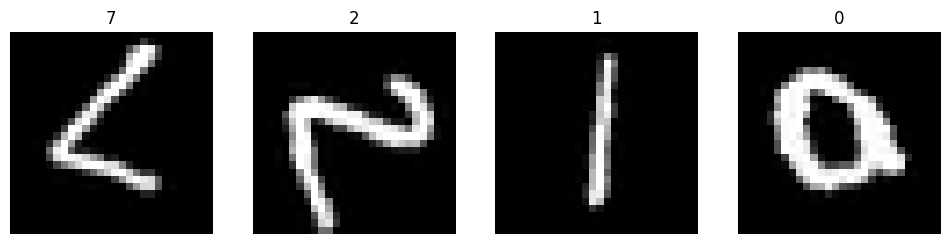
Rotated USPS digits — the 7 has become a < shape, the 2 is completely unrecognizable:
Even on clean (unnoisy) data, the rotated models couldn't match their non-rotated counterparts:
| Model | Combined Clean Accuracy |
|---|---|
| Clean Model (no rotation) | 98.26% |
| Mixed Model (no rotation) | 97.87% |
| Rotated Clean Model | 92.25% |
| Rotated Mixed Model | 92.12% |
That ~6% gap isn't a model problem — it's baked into the data. When a 6 and a 9 are literally the same shape rotated, no amount of training will reliably fix that.
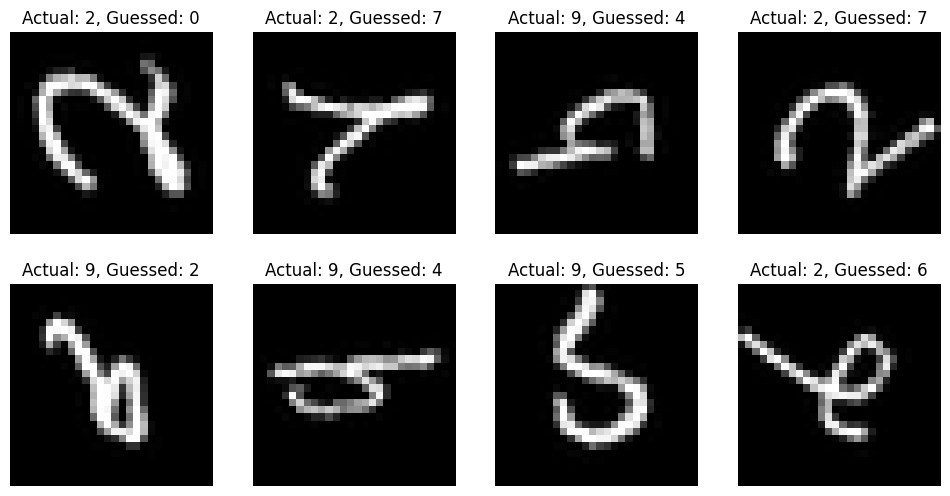
The incorrect prediction grid makes this obvious. Look at how many 9s get misclassified as 2s, 4s, and 5s — the model is seeing rotated 9s and interpreting the curves as completely different digits:
When rotation was combined with noise, things got even worse. The rotated clean model dropped to 13.99% on MNIST at full noise — that's worse than random guessing:
| Model | MNIST 100% Noise | USPS 100% Noise |
|---|---|---|
| Clean Model | 62.02% | 53.96% |
| Mixed Model | 94.51% | 90.23% |
| Rotated Clean Model | 13.99% | 12.11% |
| Rotated Mixed Model | 81.98% | 71.25% |
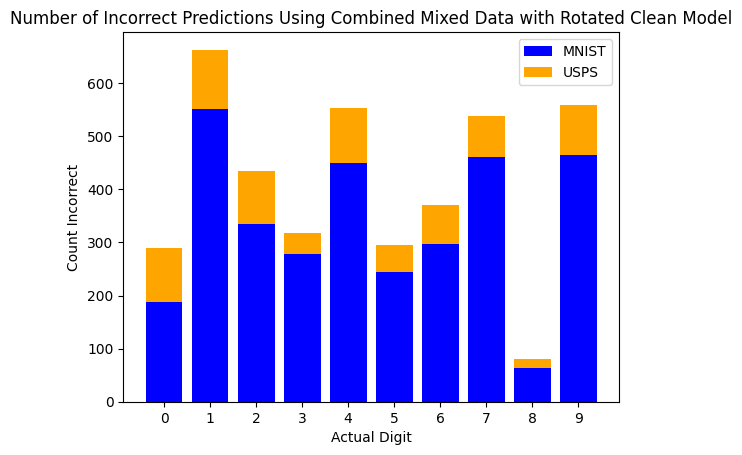
The worst case: 660 incorrect predictions on digit 1 alone when combining rotation and noise with a model not trained for noise:
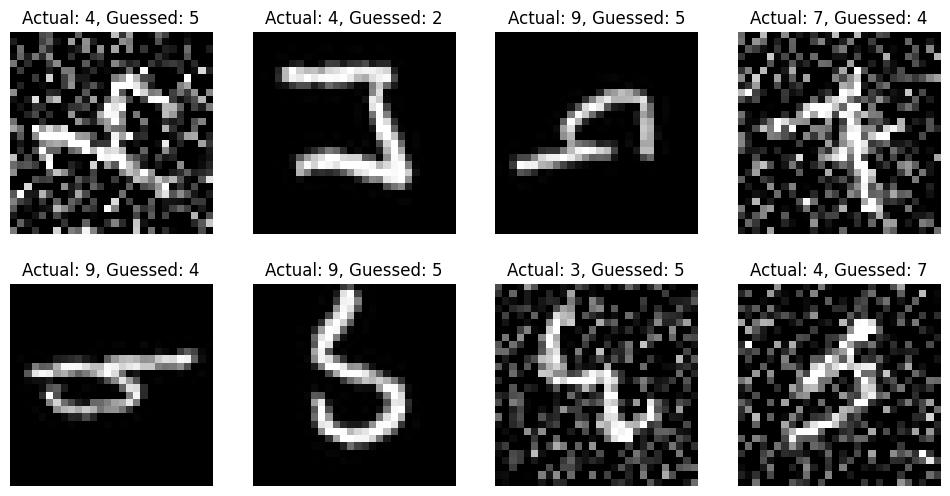
Rotated + noisy digits and the model's incorrect guesses:
My Takeaway
The conclusion I came to — and I presented this to the class, and everyone pretty much agreed — is that the only real way to improve accuracy with rotated digits is to give the model more context. If you had a string of numbers, like someone writing a three-digit zip code, you'd have multiple digits that the model could use to figure out the correct orientation. I was only giving it one number at a time, so it had no frame of reference.
Beyond the rotation problem, the noise results were honestly the most satisfying part. The fact that you can train on noisy data, lose almost nothing on clean accuracy, and gain 30%+ on degraded inputs — that's a massive win for basically no cost. If your model might encounter messy real-world data, there's almost no reason not to augment.
This project really helped me understand the deep intricacies of these models — what goes on at a fundamental level when you're building your own neural networks. It's one thing to read about convolutions and backpropagation; it's another to watch your model fail on rotated sixes and have to reason about why it's failing and what you can even do about it.